Dashboarding
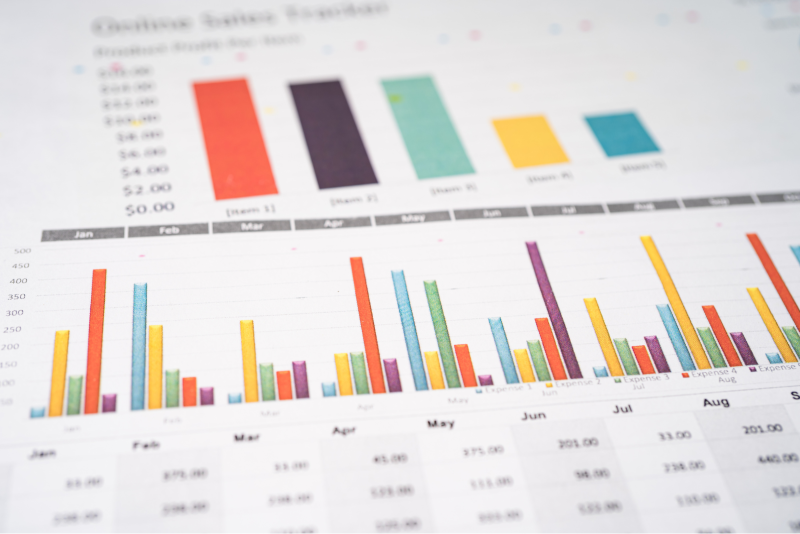
Would you like to see in one place, in a clear way, how your advertising expenses translate into sales results? That’s exactly how we operate! Aesthetically, understandably, and almost in real-time, we provide end-to-end reporting of your advertising efforts.


What does this mean for you and your team?
- A dedicated visualization space in Tableau, accessible via the web or mobile app.
- Tailored reports with answers to key questions.
- Reports customized for the audience – from the management team to specialists needing detailed analysis.
- Reliable data, always “on time”.
Our approach to reporting:
For us, reliable data is fundamental; that’s why our clients have access to reporting dashboards from the very first days of the campaign.
We work on our own MDiP platform, which makes us very flexible. There’s nothing impossible for us to visualize.
We focus on key metrics—those important for your business—while also showing the factors that shape those metrics. We don’t clutter reports with dozens of worthless tables.
We also strive to make our reports visually appealing 🙂
Simple implementation process:
We gather reporting requirements—from basic KPIs to advanced analytical needs.
We prepare the optimal data source in MDiP.
We create a draft of the dashboard, share it, and discuss what needs to be improved.
We implement the production solution.
We make modifications whenever there is a justified business need.

Read more:

Do you need a dedicated solution tailored to your needs?
Get in touch with us, and we’ll create it just for you!


